

1. Sign in and choose an organization
Open app.strandai.com. Follow your Strand invitation. On the “Get started free” page, choose “Continue with Google” or “Continue with email”. Your active organization owns the samples, credits, and runs you create. If you belong to more than one organization, open the organization menu and choose “Switch org” before uploading.2. Upload an H&E slide
Select “Upload” in the platform sidebar to open “Upload Sample”. Drag a TIFF, TIF, SVS, NDPI, SCN, or MRXS file onto “Drag and drop your slides here”, or click the drop zone to browse files. Upload only data that your organization is authorized to process. Slides must be de-identified before upload. Do not upload protected health information. See Security and data handling. “Run cell segmentation” is selected by default. Segmentation finds individual cells in the H&E and costs no credits. It is not billed like a marker run. Keep it selected for per-cell readouts. Clear it if you only need marker channels. Segmentation can be started or retried later from an SDK or MCP client. Segmentation produces viewer overlays and three artifacts on the “Export” tab: a label mask, a per-cell morphology table, and a manifest. Per-marker cell expression (mean and median per cell) is available through the REST API, the SDKs, and MCPdownload_results. The AnnData and
SpatialExperiment objects built from a prediction are pixel-grid marker
matrices, not per-cell tables.
Multiple files queue automatically, with up to two uploads active at once.
3. Wait for ingest and confirm slide scale
A single completed upload opens its sample automatically. For a batch, use the “Upload complete. Open sample” link on each completed row. Ingest preprocessing and the H&E pyramid begin automatically after the final byte is committed. Automated de-identification is off by default and runs during ingest only when enabled for your organization. The sample page shows “Slide scale confirmation required” only when the embedded physical scale is absent or conflicts with the objective metadata. Choose “Use slide tag”, accept the suggested “Use … µm/px” value, or choose “Enter manually” after checking the scanner metadata. A valid scale appears inline and is ready to use. Scale is a property of the sample, not of a run. You can correct it at any point before submitting, and a corrected value applies to every later run on that sample. See Set slide pixel size for the API, SDK, and command-line equivalents.4. Choose markers and review cost
From the sample page, choose “Submit a run” or “New run” to open “Run Lattice”.- Review the “Sample” and “Slide Scale” cards.
- Choose channels under “Select Markers”. The picker offers only markers available to the active organization and identifies completed coverage.
- Review “Eligibility and estimate”. It shows the jobs to create, exact credits, resolved samples, already-covered samples, and your organization balance.
- Select “Run Lattice (… markers)” to charge the displayed credits and submit the run.
5. Monitor the run
Submission returns to the sample’s “Markers” tab. The page reports queued and running state, completed marker count, partial delivery, or failure. You can leave the page. The run continues server-side, and the platform posts a notification when it finishes.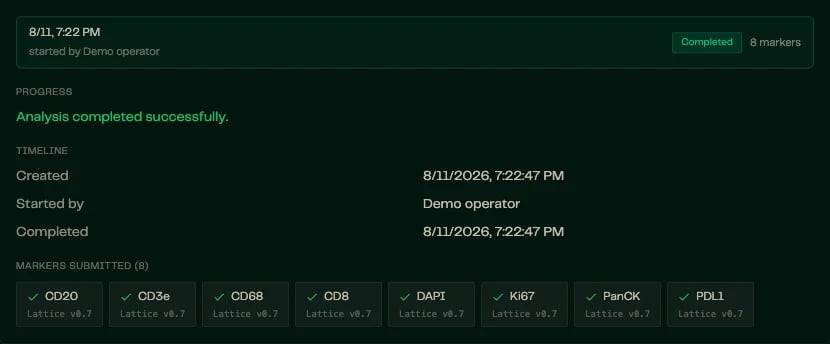
6. Inspect and download results
Open “Viewer” to compare the original H&E with delivered marker layers. Use the viewer controls to toggle markers, change colors and intensity, switch views, and inspect cell-segmentation overlays when available. See Viewer keyboard shortcuts for navigation controls.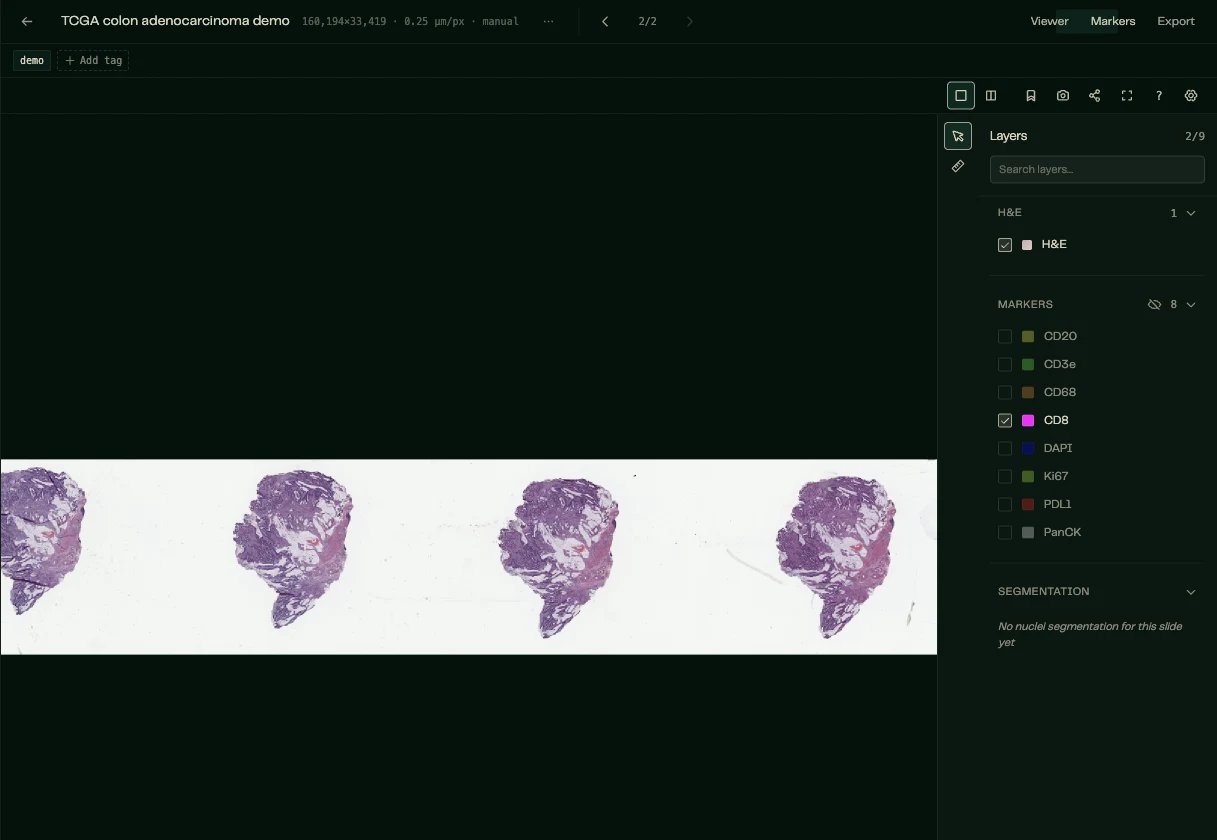
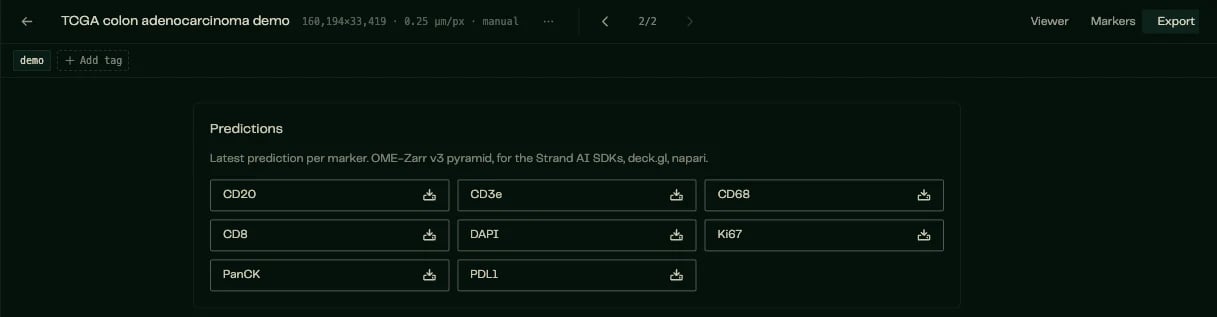
- use the marker download controls for individual OME-Zarr marker pyramids;
- choose “Generate OME-TIFF”, then “Download”, for a run-scoped pyramidal OME-TIFF after a prediction completes; and
- download segmentation layers when the sample includes them.
Programmatic workflows
SDK quickstart
Run the same workflow from Python or R with an API key.
Command line
Upload, estimate, submit, wait, cancel, and export from
strand.Claude connector
Authorize Claude against one Strand organization.
REST API
Integrate directly from another language or service.